This is Part 2 of our 2026 NYC Migration Report.
This report is about where New Yorkers moved in 2025. In Part 1 of this series we asked whether everyone is really leaving New York, and found the honest answer is more interesting than the headline: New York State is losing people to other states, while New York City itself has been holding steady. The obvious next question is the one nobody answers with real numbers. If people are leaving, where are they actually going?
So we went and got the data on where New Yorkers moved. All of it is public, all of it is cited at the bottom, and some of it will surprise you. The short version: most people who leave New York City do not leave the region. They move across a river or out to the island, and a lot of them come back.
First, an Honest Correction
Part 1 ran on New York City’s May 2025 population estimates. Since then the Department of City Planning released its Vintage 2025 numbers, and they changed the picture enough that we are not going to quietly leave the old ones sitting there.
The big revision: the city’s July 2024 population was moved up from about 8.478 million to about 8.597 million, a jump of roughly 119,000 people. That is not New Yorkers appearing overnight. It is the Census Bureau improving how it estimates international arrivals into the city, then City Planning applying the better method backward.
With that correction in place, here is the current picture. New York City’s population on July 1, 2025 was 8,584,629. A year earlier it was 8,596,825. That is a decline of 12,196 people, or about one tenth of one percent, after two straight years of real growth (roughly 71,000 in 2022 to 2023 and roughly 163,000 in 2023 to 2024). City Planning’s own summary is that the population is “remaining roughly unchanged.”
Flat is the honest word. Not booming, not emptying.
The Number That Actually Tells the Story: 113,718
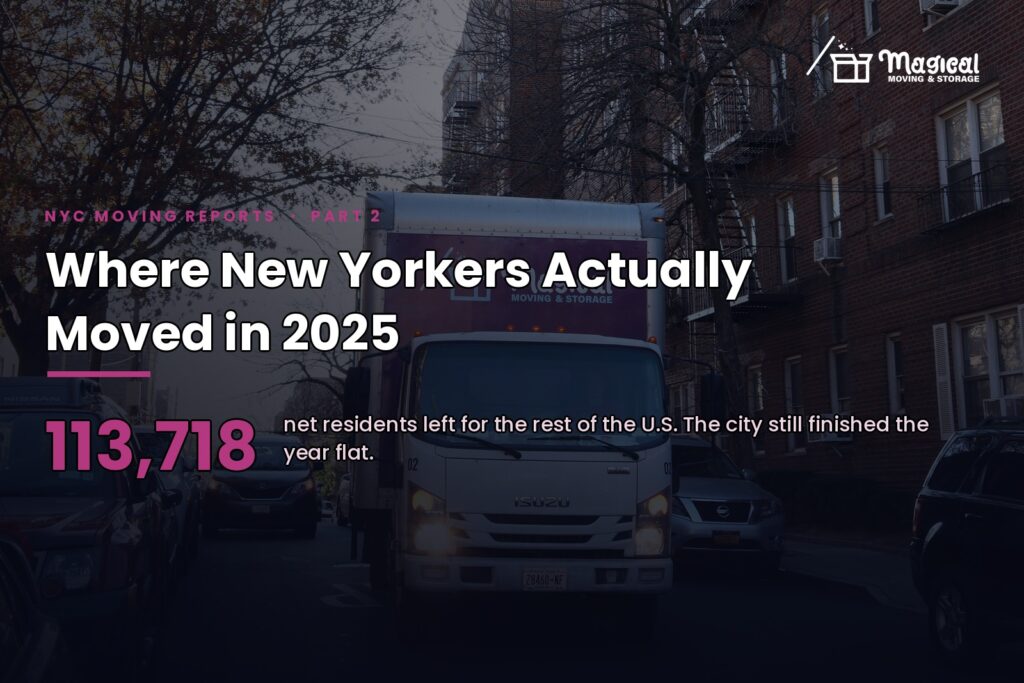
Here is the figure worth sitting with. Between July 2024 and July 2025, New York City lost a net 113,718 residents to the rest of the United States. That is domestic migration: people who moved from the five boroughs to somewhere else in the country, minus everyone who moved in from elsewhere in the country.
And the city still ended the year essentially flat. Two things filled the gap. International migration added a net 65,824 people. And births beat deaths by 53,983, with 90,084 births against 36,101 deaths.
One technical note, because we would rather flag it than have someone catch it: those pieces do not add up perfectly to the total change. City Planning says so directly, noting that the components “may not sum to the total population change because of a residual in the estimation process.” That is normal in population estimates. We are quoting the figures as published rather than forcing them to balance.
What the 113,718 really shows is churn. A city that hands over 113,718 net residents to the rest of the country in twelve months and still finishes flat is not emptying out. It is turning over, fast, which is exactly what a moving company sees on the ground every week.
The Borough Scoreboard
Now the part that actually maps. Here is how each borough moved between July 2024 and July 2025:
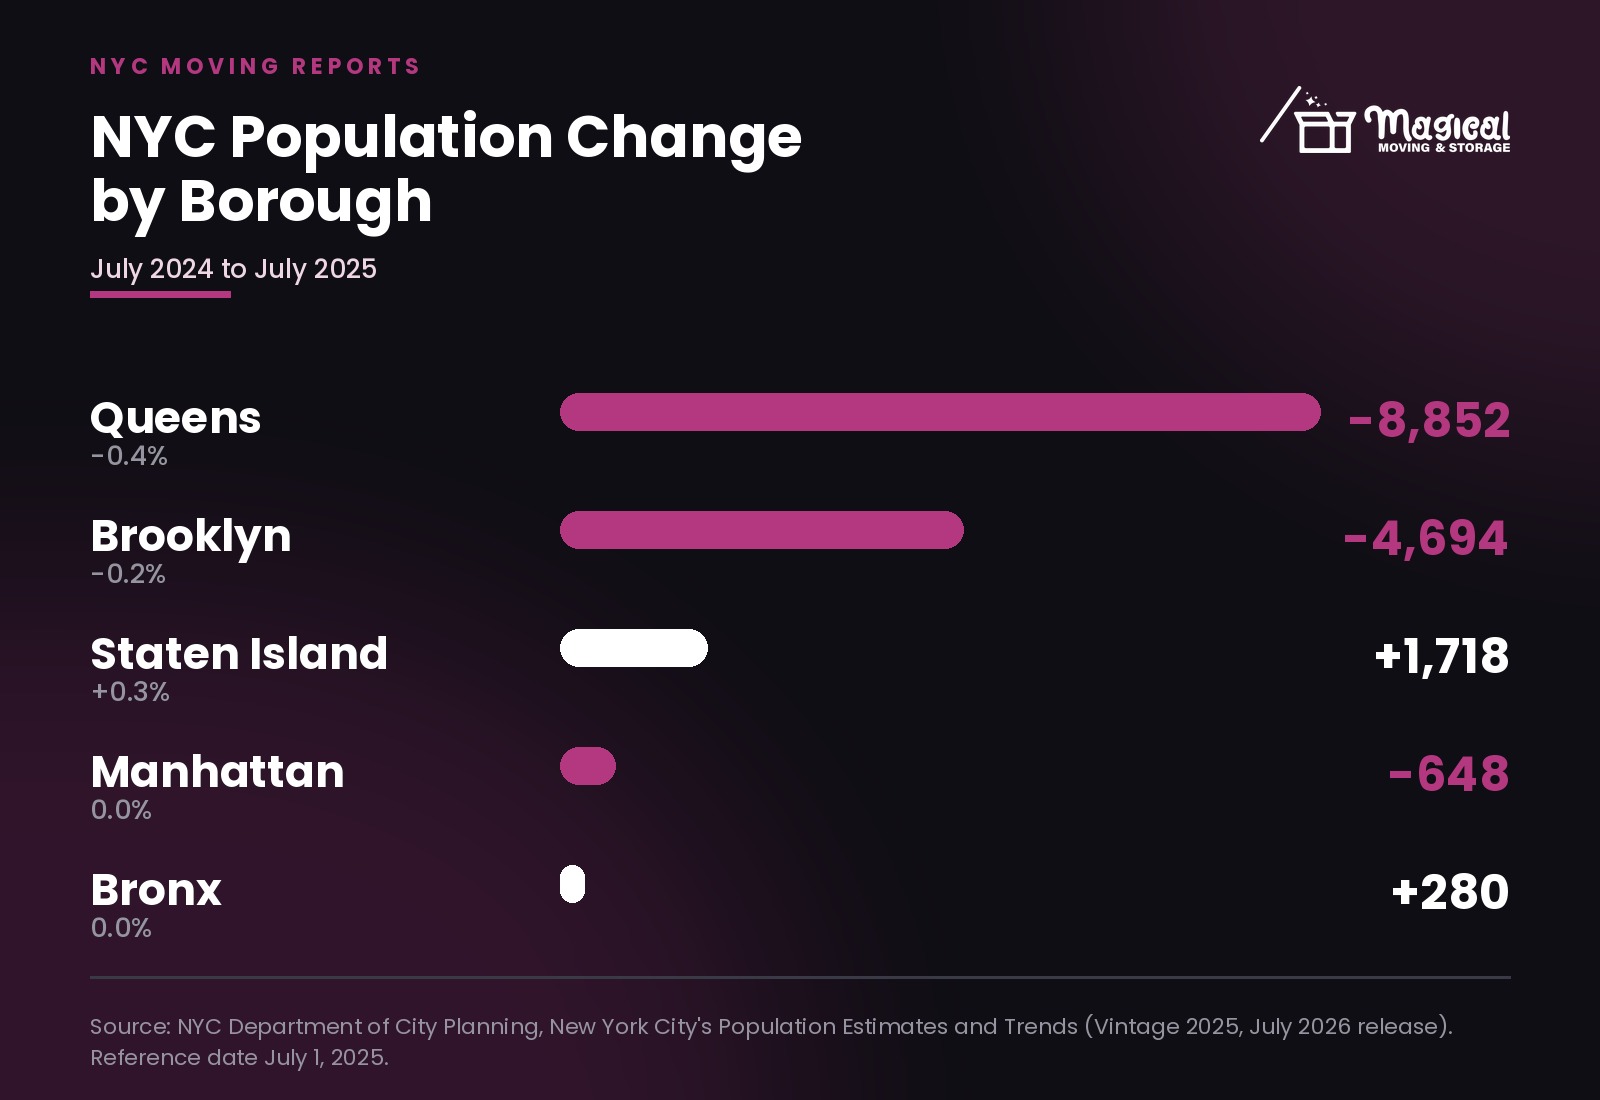
- Staten Island: +1,718 (+0.3%). The only borough with meaningful growth, and by a wide margin the one holding onto its own people. Its net domestic migration loss was just 885, compared with tens of thousands everywhere else.
- The Bronx: +280 (0.0%). Dead flat, but flat is a win here. The Bronx lost a net 18,685 people to the rest of the country and made almost all of it back with 12,760 international arrivals and 10,067 more births than deaths.
- Manhattan: -648 (0.0%). Also basically unchanged. Manhattan lost a net 16,852 domestic migrants, the smallest of the four big boroughs, and refilled with 13,270 international arrivals.
- Brooklyn: -4,694 (-0.2%). Brooklyn had the single largest domestic outflow in the city at a net 38,847 people, offset by 17,564 international arrivals and 15,628 in natural increase.
- Queens: -8,852 (-0.4%). The largest population drop of any borough. Queens lost a net 38,449 domestic migrants and, notably, took in more international arrivals than anywhere else in the city at 20,672, and still finished down.
Read the domestic migration column and Brooklyn and Queens are the engines of the whole story. Between them they account for roughly 68 percent of the city’s entire net domestic outflow. If you want the on-the-ground version of that number, our guides to moving to Queens and the cost of moving in Brooklyn are the two most-read things we publish, and it is not a coincidence.
Where New Yorkers Moved: Mostly, Not Far
This is the question every “New Yorkers are fleeing” article dodges, and there is a reason. Getting a real answer is harder than it should be, because the US Census Bureau stopped publishing its county-to-county migration flow tables after the 2016-2020 American Community Survey release. There is no fresh federal table that says “this many people moved from Brooklyn to Broward.”
What still exists is IRS data. The IRS tracks address changes on tax returns year to year and publishes county-to-county migration files. The most recent county-level analysis of New York City comes from tax year 2022 data, published in 2024, analyzed by PropertyShark. It is two to three years behind. It is also the best county-level destination data anyone has, including the outlets writing confident headlines about 2025.
Here is what it shows, and it is not Miami.
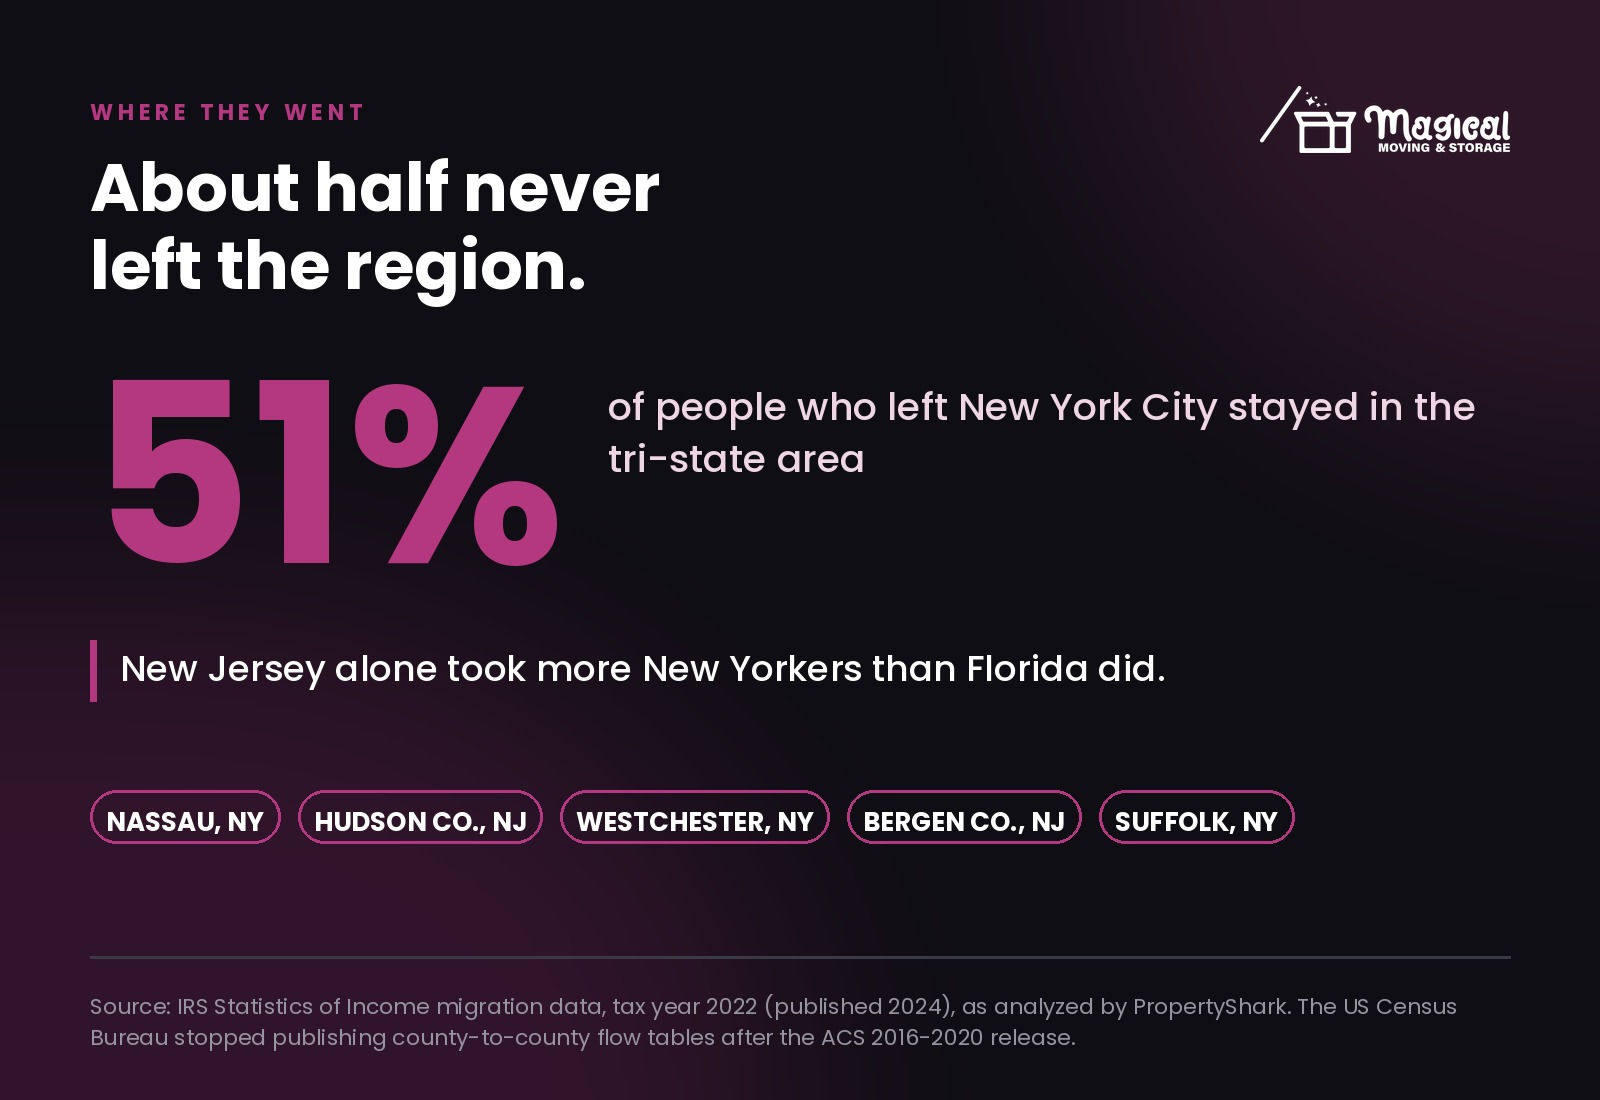
About 51 percent of the people who left New York City stayed in the tri-state area. Half the “exodus” moved a distance you could drive in under an hour.
The single biggest destinations:
- Nassau County, NY: roughly 20,600 net loss to Long Island, the largest of any county.
- Hudson County, NJ (Jersey City, Hoboken, Bayonne): about 13,219 departures from the city.
- Westchester County, NY: roughly 11,200 net loss.
- Bergen County, NJ: about 10,500 departures.
- Suffolk County, NY: roughly 8,550 net loss.
- New Jersey overall: about 63,800 people moved from NYC to New Jersey, for a net loss of roughly 40,000.
- Florida overall: about 38,400 people, with Miami-Dade accounting for a net loss of roughly 4,050.
- Los Angeles County, CA: about 7,600 departures.
New Jersey alone took more New Yorkers than Florida did. That single fact undercuts most of what gets written about this subject. If you are looking at that list and recognizing your own plan, we have written both of those moves up in detail: moving from NYC to Long Island and NYC to Jersey City and Hoboken.
The Door Swings Both Ways
The other half of the story never makes the headline: people move back. In the same data, New York City took in 12,692 people from Nassau County, 9,564 from Westchester, 7,323 from Suffolk, about 23,800 from New Jersey, and about 16,000 from California, including roughly 5,400 from Los Angeles County alone.
That is what a revolving door looks like in numbers. The city loses to the suburbs and gains from them at the same time, in enormous volume, every single year. Net figures hide that. Gross figures show a city constantly trading people with the places around it.
And the People Who Do Leave the Region
If someone leaves the New York metro area entirely, then yes, the South wins. Bank of America Institute’s January 2026 migration report, built on a fixed sample of roughly 45 million customer accounts through 2025, found that more than 45 percent of outbound New Yorkers headed South, with Miami alone accounting for over 7 percent of departures. It also found steady two-way flows with Boston, Washington DC and Philadelphia, and that Los Angeles supplies about 6 percent of people arriving in New York.
Both things are true at once, and the difference is what each dataset counts. Bank of America is watching people move between metro areas, so a Brooklyn to Jersey City move mostly does not register as leaving. The IRS county data captures those short hops. Put them together and you get the accurate version: most people leaving the five boroughs stay in the region, and among the minority who genuinely leave the region, the South and Florida dominate.
One Warning About “Hottest Neighborhood” Lists
Every January a wave of articles announces the neighborhoods New Yorkers are moving to. Read the methodology. Almost all of them are search data.
StreetEasy’s 10 Neighborhoods to Watch in 2026 is the one most widely repeated, and StreetEasy is upfront about what it measures: the neighborhoods with the biggest year-over-year increase in searches from buyers and renters between 2024 and 2025. The top of the list is Financial District (+46.7 percent in searches, median asking rent $4,690), East Village (+45.8 percent, $4,650), Windsor Terrace (+44.9 percent, $3,800), Lower East Side (+44.4 percent, $4,500), Carroll Gardens (+44.4 percent, $4,500), Downtown Brooklyn (+44.3 percent, $4,448) and Sunnyside (+43.7 percent, $2,695), followed by Ridgewood, Long Island City and Fort Greene.
That is genuinely useful. Search interest is a real leading indicator of where demand is heading, and it is a fair predictor of where rents get bid up next. It is just not a migration statistic. Nobody moved anywhere by searching. When you see one of those rankings described as “where New Yorkers are moving,” it is being oversold, and now you know how to check.
We are going to dig into what that list means at street level in Part 3 of this series, because three of those neighborhoods are the exact “compromise” pockets absorbing renters priced out of the block next door.
What This Actually Means If You Are Planning a Move
Three practical takeaways from all of the above.
- Your move is probably shorter than you think. The most common New York City relocation is not a cross-country haul. It is a move to Hudson County, Nassau, Westchester, Bergen or Suffolk. Those are day jobs, priced hourly or as a flat local rate, not interstate freight.
- Cross-river and Long Island moves have their own rules. A move to Jersey City is an interstate move on paper, which changes how it is regulated and quoted even though the drive is fifteen minutes. Ask any mover to explain that difference before you book. If they cannot, that tells you something.
- The churn is real, so book early. A city turning over 113,718 net residents a year, plus everyone moving within it, means peak weekends sell out. Our guide to what movers actually cost in NYC breaks down what drives the price on all of these.
Sources
Every figure above, in order, so you can check our work or cite it:
- NYC population, borough figures and components of change: New York City Department of City Planning, “New York City’s Population Estimates and Trends” (Vintage 2025, July 2026 release), reference date July 1, 2025.
- Why county-level destination data is dated: US Census Bureau, County-to-County Migration Flows guidance. Flows are published up to and including the release of the ACS 5-year 2016-2020 dataset.
- Destination counties and return flows: IRS Statistics of Income migration data, tax year 2022 (published 2024), as analyzed by PropertyShark, “Loving or Leaving New York: Domestic Migration In and Out of NYC.”
- Out-of-region destination mix: Bank of America Institute, “On the Move: US Migration Patterns,” January 2026, based on a fixed sample of approximately 45 million customer accounts.
- Neighborhood search demand: StreetEasy, “10 NYC Neighborhoods to Watch in 2026,” measuring growth in buyer and renter searches from 2024 to 2025.
If you are a reporter or a researcher and you want to use any of this, please do. A link back is appreciated.
Coming Next in This Series
Part 3, “NYC’s Priced-Out Map,” goes one level deeper: the neighborhoods quietly absorbing the people priced out of the neighborhood next door, and what the rent gap between each pairing actually is. If you have not read Part 1, on whether everyone is really leaving New York, start there.
The Bottom Line
New Yorkers did not empty out in 2025. They rearranged. The city handed a net 113,718 people to the rest of the country, took back 65,824 from abroad, delivered 90,084 babies, and finished the year within a rounding error of where it started. Ask where New Yorkers moved in 2025 and the honest answer is that about half of them never left the region at all. They went to Nassau, to Hudson County, to Westchester, to Bergen, and a good number of them will move back.
We know, because we drive those routes constantly. Whether you are going from Astoria to Sunnyside or from Park Slope to Montclair, tell us the two addresses and we will tell you exactly what it costs. We run crews across all five boroughs and into the tri-state, seven days a week, backed by 863 five-star Google reviews. Call (212) 933-9959 or get a free quote at magicalmovingnyc.com.
Magical Moving & Storage is a licensed and insured NYC moving company. USDOT 4144902, MC 1589978, NYSDOT 42311. Local moves from $295. Population and migration figures are quoted from the public sources listed above and were current as of August 2026.